|
|
|||||||||||||||


|
||||||||||||||||


|
||||||||||


|
|||||||||


|
||||||


| A Cosmic Voyage to Jupiter |
|
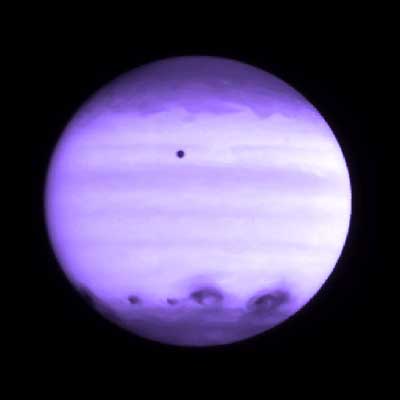
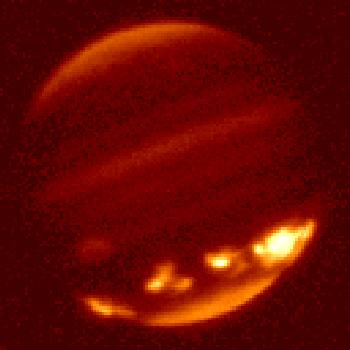
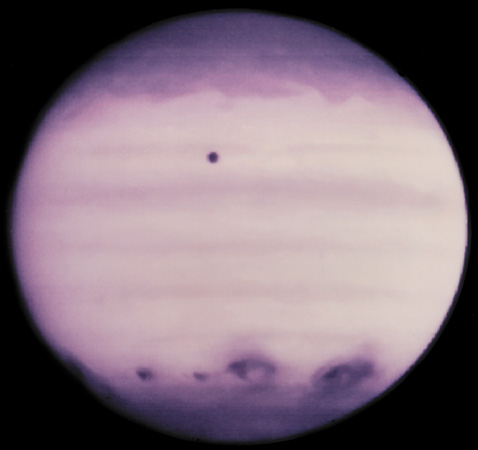
Jupiter is shown
here in full disk images taken by Voyager 1 (top). These images have been enhanced to bring out various
color tones and (bottom) and were taken from the Galileo spacecraft that reached the planet 18 years later which affords a closer
approximation to the true color of this planet's atmospheric exterior. In one sense, Jupiter is the most important of the solar planets in that its size and mass have played a major role in the development and survival of the inner (terrestrial) planets. It does two vital things: its gravitational action on these planets have slowed their inward progression towards the Sun and it helps to keep most large asteroids from continually bombarding the inner planets. The jovian atmosphere is approximately 75% hydrogen and 24% helium by mass, with the remaining 1% of the mass consisting of other elements. The interior contains denser materials such that the distribution is roughly 71% hydrogen, 24% helium and 5% other elements by mass. The atmosphere contains trace amounts of methane, water vapor, ammonia, and silicon-based compounds. There are also traces of carbon, ethane, hydrogen sulfide, neon, oxygen, phosphine, and sulfur. The outermost layer of the atmosphere contains crystals of frozen ammonia. Through infrared and ultraviolet measurements, trace amounts of benzene and other hydrocarbons have also been found.
The most obvious features of Jupiter's gaseous surface are the
colored bands (from chemical reactions), in which the darker reddish-browns
are called belts (low pressure atmospheric motion) (temperatures around
-147° C) and the lighter, more bluish are zones (higher pressure)
(temperatures about -154° C). Belts (atmosphere rises) and zones (atmosphere sinks) also move in opposite directions. The orange, red, and brown coloration in the clouds of Jupiter are caused by upwelling compounds that change color when they are exposed to ultraviolet light from the Sun. The exact makeup remains uncertain, but the substances are believed to be phosphorus, sulfur or possibly hydrocarbons. Nomenclature for the belts and zones are given in this illustration (from Wikipedia).
In Jupiter's northern hemisphere, jet winds
at velocities up to 600 km/hr (420 mph) blow westward south of zones and north
of belts and eastward north of zones and south of belts; this is reversed in
the southern hemisphere. Global cloud decks include an outer layer of ammonia
ice crystals, above a layer containing small amounts of ammonium hydrosulphide
(NH4SH), and possibly a water ice crystal layer beneath. Upwelling
in the belts may convert the NH4SH (perhaps including also phosphorus
compounds) into the darker reds by photochemical reactions with sunlight. This
profile diagram describes the pressure-temperature-composition relations in
the jovian atmosphere: A hallmark of Jupiter's atmosphere
is the prominent Great Red Spot (GRS), an oval feature (25000 x 12000 km [15500
x 750 miles]) that has persisted at least since its discovery by telescope in
the 17th century. The GRS is a high pressure disturbance caused by thermal convection
that carries gases up to 8 km (5 miles) higher than its surroundings, thus cooling
them; its anticyclonic winds move counterclockwise (in the southern hemisphere)
as it drifts through the bands. The GRS experiences a complete rotation in about
6 days. The false color view below is a Voyager close-up of the GRS in which
images made by the red and blue filters are enhanced relative to green which
also helps to emphasize some of the swirls and plumes peripheral to it. Red
areas are higher than blue above the level of the jovian atmosphere that appears
as a quasi-surface. Theories supported by laboratory experiments suppose that the GRS's color may be caused by any of "complex organic molecules, red phosphorus, or yet another sulfur compound", but a consensus has not been reached.
The GRS has existed much as is since first observed by Galileo. More recent are two more Red Spots as seen here (the one at the same latitude as the GRS first appeared in the spring of 2008):
The Red Spot at a more southern latitude has been around since the 1940s (it developed from the merger of several storms). Named the Little Red Spot (LRS)(it does not appear red in the image below) because different wavelengths are involved), the swirling patterns of individual curve cloud streaks indicate fast motion of the gases; a maximum wind speed of 524 kph (385 mph) has been measured: But other cyclonic storms can have much shorter durations. Sometimes two storm spots within a band will close the gap between them and even merge, as shown in this sequence: Here is a color version of two of the circulating features known as White Ovals: The Galileo spacecraft has returned numerous images showing details in the circulation patterns of individual bands. Here is one typical example:  Multispectral imaging of Jupiter helps to reveal variations in the compositional banding and the appearance of cyclonic spots. In this next view, the three images were made in the Visible Blue (left), the Ultraviolet, and the Near IR (right)  In February, 2007, the New Horizons spacecraft passed Jupiter enroute to Pluto (see page 19-21). It proved the quality of its instrumentation with excellent looks at the planet and its moons. Here is a closeup of the atmosphere; note that a thin visible cross-section of the outer atmosphere shows at the limb.  One of Voyager's discoveries is that Jupiter has a ring system. It is more nebulous than Saturn's rings, as evident in this image.  The ring's inner edge begins at about 123,000 km (76,432 mi) from the planet's center. Its fine particles, still effective as sunlight reflectors, form a continuous band about 5,200 km (3,231 mi) wide and 30 km (18.6 mi) thick that shows no conspicuous gaps. After the Voyagers, Jupiter has been revisited in the '90s. The primary objective for the Galileo mission was to penetrate the jovian atmosphere. This spacecraft, launched on October 13, 1989, separated its probe from the Orbiter on December 7, 1995. The probe’s initial velocity on entering was about 106,000 km/hr (65,868 mph), but it then slowed greatly, due to atmospheric friction aided by a deployed parachute. It transmitted data for 57 minutes, as it descended in excess of 150 km (93.2 mi), where the pressure exceeded 24 bars (23.7 atm) at a temperature around 150° C. It encountered no thick, dense clouds, and it detected less sulphur, oxygen, and neon than expected, but found no water. The helium levels were above what was expected. The data overall suggested the probe may have entered at an anomalous hot spot, with abnormal cloud conditions. As it observed Jupiter, the Orbiter saw evidence of large thunderstorms, with rain, and some lightning. The Orbiter also monitored the Galilean satellites, taking close-ups of their surfaces that surpass those of Voyager. Galileo spent part of its observing time monitoring Jupiter's atmosphere. The bands and convection plumes show temperature differences that broadly correlate with the patterns these atmospheric features assume. This correlation is evident in the Galileo Orbiter view, below, of a segment of bands and spots, in which the temperatures derived from the photopolarimeter divide into warmer (yellow) and somewhat cooler (orange-red to black) zones. 
The jovian atmosphere is not only dynamic and turbulent but is electrically
charged, as is evident from this next view that shows lightning-like discharges,
imaged when the Orbiter is looking at the nightside of Jupiter's outer atmosphere.
These are the first visible lightning flashes seen on another planet.  This next image associates lightning strikes (bright marks in lower insert) with a specific, localized storm in the atmosphere.  Jupiter has both the strongest (10x that of Earth) and the largest magnetosphere of any solar planet. The magnetic field extends out to at least 100 jovian radii from the planet (reaching to Saturn). If seen in real size from the Earth, in which Jupiter appears at its normal size, the field would cover space on the celestial sphere equal to almost three times the full Moon. Here are two plots of the magnetosphere: one using radiowaves to visualize the field; the lower one constructed from data gathered by a sensor aboard the Cassini spacecraft: 
The Orbiter also observed aurora effects as rings at the north and south magnetic
poles. The view below shows a Galileo visible image of the planet, on which
are two superimposed insets made with the UV camera on the spacecraft.  Ultraviolet auroral light comes from emissions resulting from excited ions and electrons emanating from the innermost satellite, Io, released during volcanic activity (see the next page) that Jupiter’s magnetic field captured and concentrated in the polar regions. Jupiter is an emitter of strong radio waves (peaking at 10 cm), caused by both thermal and non-thermal processes. These waves come from the Van Allen-like radiation belts around the planet. The belts trap electrons, producing a field of 400000 rad strength (enough to kill any astronaut caught within it). Here is a plot of the detected radiation belt around Jupiter:  Jupiter continues to be a target of additional imaging and data gathering. The Cassini spacecraft, enroute to Saturn for a rendezvous in 2004, passed by Jupiter on December 30, 2000 and continues to acquire information. Although the images are not much different from those obtained by Galileo, they do extend the monitoring and add more instrumental analysis. Here is a view of part of the jovian surface and the satellite Io; this helps to realize how small are these "moons" relative to the huge size of the planet.
|